

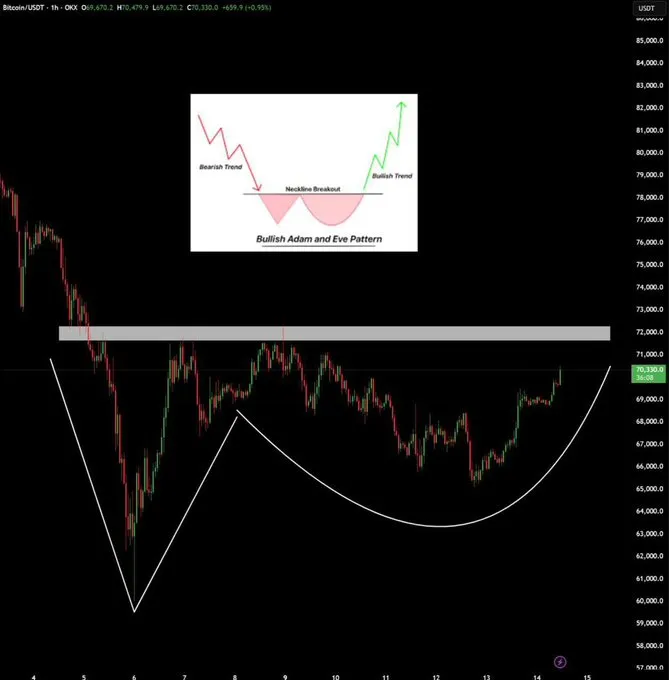
A bullish “Adam and Eve” pattern has appeared on the chart of the leading cryptocurrency — a break above $72,000 would push the asset towards $80,000, noted the analyst known as Ash Crypto.
He also noted that the OTHER/BTC index has reached a four-month high and is above the levels seen at the time of the crash on 10 October 2025.
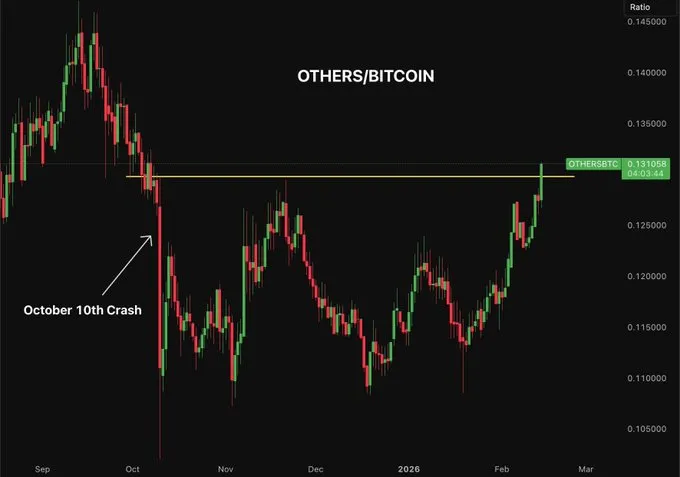
“Altcoins are holding up well against bitcoin, and we could see their rally very soon,” added Ash Crypto.
In the view of MN Trading’s founder, Michaël van de Poppe, digital gold has held in a “potential bounce” area, opening the way to $80,000.
Potential bounce area on #Bitcoin has held.
Now; it’s time for the continuation towards $80k.
It’s good to see that #Altcoins are acting stronger. pic.twitter.com/QMBMmQXzIk
— Michaël van de Poppe (@CryptoMichNL) February 15, 2026
However, the analyst known as Daan Crypto pointed to little change in the Coinbase premium. The discount remains “pretty hefty”, as it has for much of 2026.
$BTC Not much change in terms of the Coinbase premium which can be seen at the bottom of the chart.
Still a pretty hefty discount which has been the case for pretty much all of 2026.
This is of course on the back of the bearish price action and net outflows of spot ETFs this… pic.twitter.com/sMrezRdZdP
— Daan Crypto Trades (@DaanCrypto) February 15, 2026
“This is of course on the back of the bearish price action and net outflows of spot ETFs,” he explained.
Where is the bottom?
Alphractal’s founder and CEO Joao Wedson described a way to identify bitcoin’s lows. He uses the long-term holders’ (LTH) realised price metric.
Another curious way to identify Bitcoin bottoms. 👀
Historically, the major bottoms occurred when the price reached the -0.2 standard deviation level of the LTH Realized Price. This point marked classic capitulation phases and the final opportunity to buy before a new Bull… pic.twitter.com/C73lXWaj9i
— Joao Wedson (@joao_wedson) February 14, 2026
Historically, the main lows have formed when the price of the leading cryptocurrency reached the -0.2 level relative to the indicator.
“This point marked classic capitulation phases and the final opportunity to buy before the start of a new bull market. Today the behaviour is different. The price cannot hold above +1 of standard deviation, indicating continued aggressive selling by bears in these areas,” clarified Wedson.
The LTH realised price line acts as support and resistance, the expert believes. When the metric approaches extremely negative readings, the likelihood of a structural bottom increases.
The crypto trader known as Satoxis noted aggressive whale buying. By his analysis, exchange outflows average 3.2% over 30 days. That points to ongoing accumulation as large holders withdraw bitcoin from trading platforms.
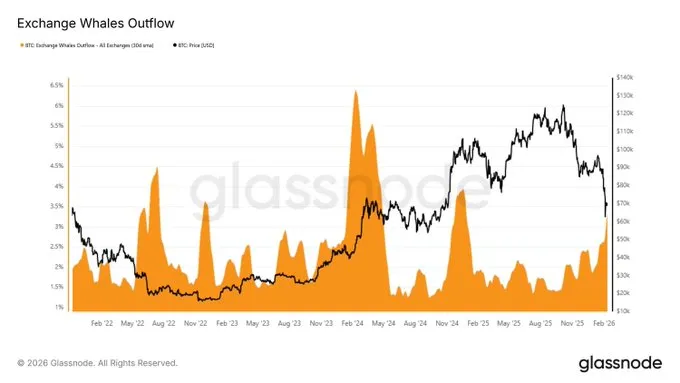
“When big investors move coins at this pace, it reduces the available supply on exchanges, cuts liquidity and creates conditions for a sharp rise once demand recovers. Retail investors remain wary,” stressed Satoxis.
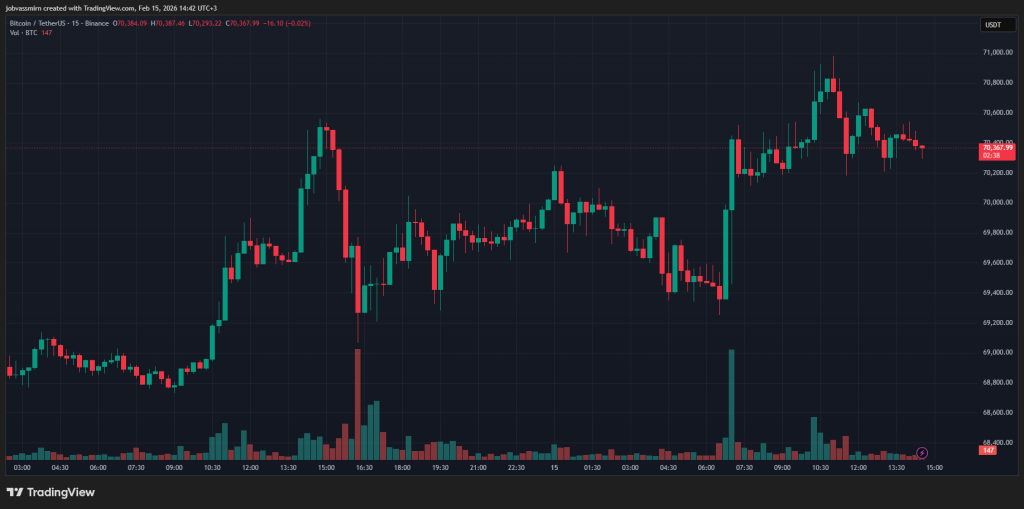
At the time of writing, bitcoin trades around $70,300, up about 1.5% on the day.
Earlier, CryptoQuant analysts questioned whether the correction in the leading cryptocurrency had ended. Despite large-scale loss realisation, on-chain metrics have yet to confirm the formation of a structural bottom.